Different Methods for Generating Synthetic Data
Accurately representing feature distributions, transformations, and temporal dependencies adds layers of complexity to the use of Synthetic Data.
Striking a balance between mimicking real-world complexities and preventing overfitting in synthetic datasets is vital. Innovative methodologies, including advanced statistics, generative AI, and machine learning (ML)-based models, such as deep learning transformers and LLMs (Large Language Models), show promise in creating synthetic tabular data that captures real-world intricacies and in overcoming these challenges.
Generating Synthetic Data involves various methods, each with its distinct approach and nuances. Differential Privacy, Generative Adversarial Networks (GANs), and Transformers stand out as prominent techniques, with each offering unique solutions and challenges.
Differential Privacy
Differential Privacy prioritizes safeguarding privacy while maintaining statistical relevance. By introducing noise into the data, it shields sensitive information without significantly compromising overall statistical integrity. However, a drawback emerges in its treatment of individual features separately, potentially leading to inaccuracies in capturing dependencies and correlations among the features. This method excels in preserving privacy but may fall short in accurately representing intricate feature interplays within the data.
Generative Adversarial Networks - GANs
On the other hand, Generative Adversarial Networks - GANs, comprised of generator and discriminator models, take a different approach. The generator is crafting synthetic samples resembling real data, while the discriminator assesses their authenticity. GANs excel in capturing feature interplay and dependencies, ensuring a more realistic representation of the original dataset. However, these models often demand substantial data for convergence, struggle with rare data segments, and require fine-tuning tailored to the dataset's nature.
Transformers
Transformers, leveraging Large Language Model (LLM) architectures, have recently emerged as a novel approach, especially in non-structured data, but also in handling tabular data. This technique treats rows of tabular data similarly to sentences, utilizing text models to generate new rows. The beauty of Transformers lies in their adaptability to tabular data without the need for extensive fine-tuning. However, while they eliminate the intricacies of fine-tuning, their adaptation to text-based methodologies for tabular data might pose challenges in certain contexts.
Related: Revolutionize Auto Insurance Underwriting with AI-Driven Risk Assessment
Effectiveness of Synthetic data
Synthetic data generation opens new opportunities for insurance companies to collaborate with academic and research institutions, Insurtech companies, or software vendors. It allows carriers to share data that otherwise might be too sensitive to share, even with other departments within the organization.
Often the owners of the data within the organization have concerns about letting research and data science departments work directly on the original data. Synthetic Data can be effective in addressing these concerns. However, the level of investment and the method(s) for generating Synthetic Data will depend on the specific needs of the different parties.
Questions that arise include:
The short answer is, as always, that it depends on the specific usage of the data generated. In other words, do we need to develop very accurate predictions based on the data, do we want to explore different modelling approaches as part of the research, or do we need representative data for performing some QA and testing? Our current research shows some encouraging results in terms of the capabilities of the different Transformers-based algorithms we have tested to date.
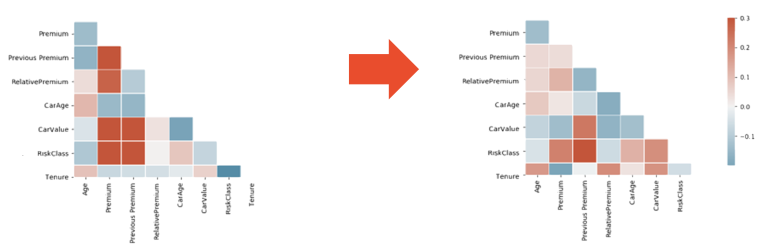
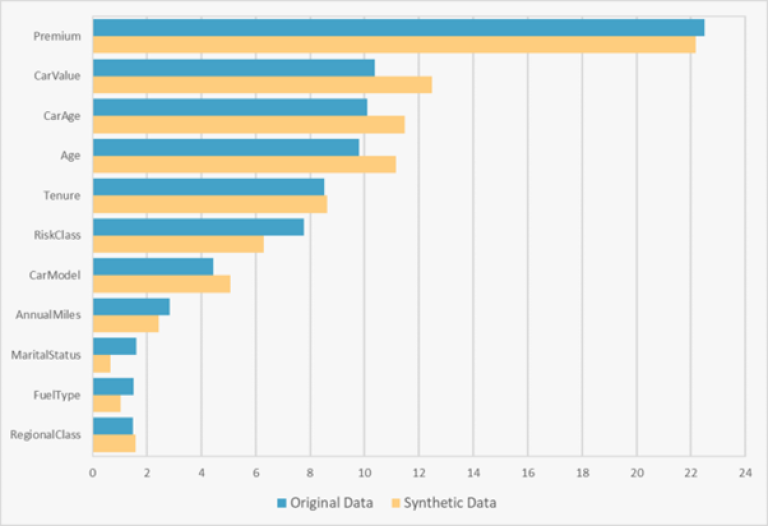
The initial step in assessing Synthetic Data quality involves examining feature distributions and performing one-way analysis. While individual feature distributions offer a basic sanity check, they alone often do not fully account for multi-feature dependencies. The aim is for each feature's distribution in the Synthetic Data to resemble that of the original dataset, though it doesn't need to be an exact match due to the inherent stochastic nature of Synthetic Data generation.
Additionally, one-way analysis serves as a valuable tool for comprehending the interplay between the target feature and the explanatory variables. This analysis focuses on both specific graph values and the overarching trends observed within the data.
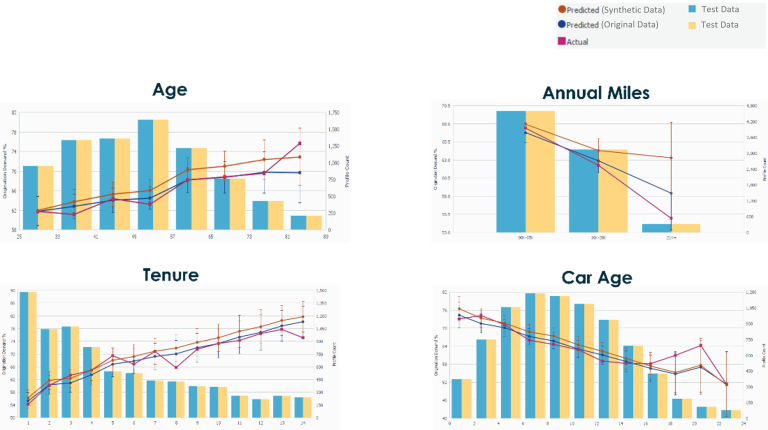
In our example, the dataset is an auto insurance policy renewal database with ~40K observations, where the target variable is renewal indicator, and some of the explanatory variables are Age, Annual Miles, Tenure, and Car Age.
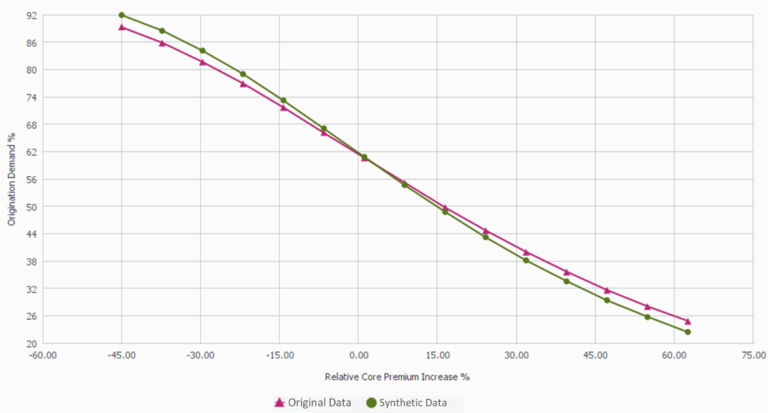
The following charts represent a one-way analysis of the relationship observed in the original data (for a test sample) between the renewal rate and key rating variables, and how well this relationship is captured by logistic regression models based on original and Synthetic Data samples (training samples).
As we can see from the charts, both the original and Synthetic Data-based models perform similarly in mimicking the observed relationships for key features.